- What is a combined sewer system?
- Why does our combined sewer system overflow?
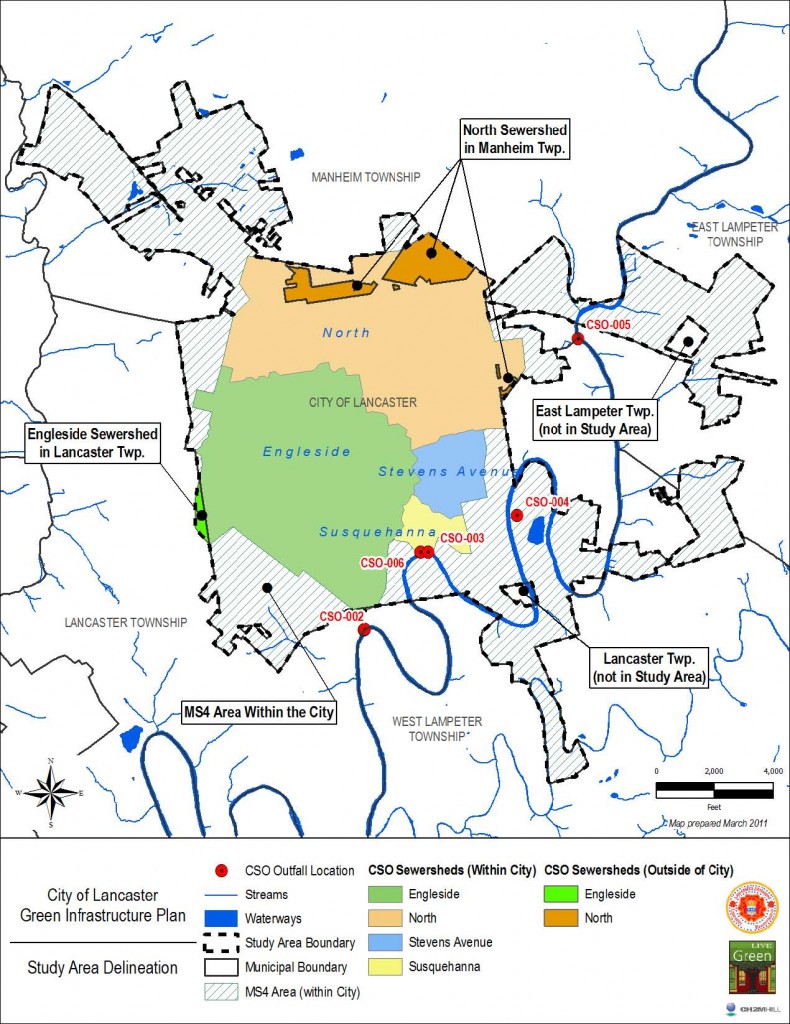
- Does the combined sewer system cover the entire city?
- How much water overflows?
- Why must the City work to eliminate its combined sewer overflows?
- What is the City doing about this problem?
- Why did the City create a green infrastructure plan?
- What is impervious surface?
- What is the difference between gray infrastructure and green infrastructure?
- What are some of the benefits of green infrastructure?
- What is the estimated cost of the City’s green infrastructure plan?
What is a combined sewer system?
A combined sewer system collects and transports both domestic sewage and rainwater. Approximately 770 cities in the United States have combined sewer systems and they are very common among City’s as old as ours (Lancaster City is over 300-years-old). Most newer communities have separate sewer systems that separate domestic sewage from rainwater.
Why does our combined sewer system overflow?
Eighty-five percent of the time, Lancaster City’s one wastewater treatment plant is able to manage and clean the volume of wastewater flowing through this combined system. However, during rainstorms and other wet weather events, the system becomes overwhelmed and the untreated combined sewage flows into the river. These events are referred to as combined sewer overflows (CSOs).
Does the combined sewer system cover the entire city?
The combined sewer system covers 45 percent of the city.
How much water overflows?
About 750 millions gallons of polluted water overflows into the Conestoga River each year. Eighty-five percent of the time, the City’s Advanced Wastewater Treatment Facility is able to manage and clean the volume of water flowing through this combined system.
Why must the City work to eliminate its combined sewer overflows?
There is a renewed focus on cleaning up local waterways—like the Conestoga River—that fail to meet water quality standards and contribute pollution to the Chesapeake Bay. The Environmental Protection Agency, for example, has begun enforcing limits on nitrogen, phosphorous and sediment pollution, referred to as a Total Maximum Daily Load (TMDL). The TMDL or “pollution diet” requires all communities located within the 64,000 square mile Chesapeake Bay watershed to ensure that cleanup commitments are kept. These requirements apply to communities with combined sewer systems and separated systems.
What is the City doing about this problem?
The City of Lancaster is doing two things:
- Working to ensure the existing “gray infrastructure” including the wastewater treatment plant and all the pumping stations around the City that move wastewater to the plant are operating at maximum efficiency.
- Implementing more “green infrastructure” projects throughout the City. In May 2011, the City of Lancaster completed a green infrastructure plan that lays out a 25-year strategy that will eliminate the City’s combined sewer overflows into the Conestoga River. There are already many projects completed and underway.
Why did the City create a green infrastructure plan?
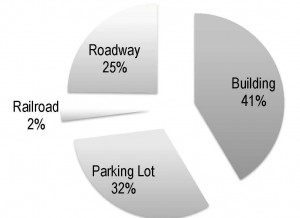
The City of Lancaster comprises 7.34 square miles and includes 241 acres of publicly-owned park land and playgrounds, 135 miles of streets of which 27 miles are classified as alleys, and over 860 acres of buildings. As with most cities, it is largely paved over with buildings, roads, parking lots, sidewalks, and other hardscaping features.
What is impervious surface?
Any surface that water cannot soak into. Examples include asphalt (e.g., streets), concrete (e.g., sidewalks) and rooftops. When water can not soak into the ground, it either sits in one place forming a puddle or it moves along to a place it can soak into the ground or be collected. In the City of Lancaster, most of the rain water is captured in one of the City’s 2,000 storm drains. As water moves along streets, sidewalks and other impervious surfaces it carries with it garbage, oil and other automobile fluids, fertilizer, salt and pet waste.
What is the difference between gray infrastructure and green infrastructure?
Gray infrastructure is a man-made system essential in every community that includes sewer and wastewater facilities. These systems generally require energy to operate and are often quite expensive to build and maintain over time.
Green infrastructure, in contrast, employs natural systems to manage rainwater where it falls, allowing water to soak into the ground, evaporate into the air or collect in a rain barrel or cistern. Thereby using natural systems (such as the ground) to essentially do the treatment of this rainwater rather than expensive gray systems built by man. There are many types of green infrastructure technologies. These include tree canopies, native shrubs, green roofs, rain gardens, porous pavement, rain barrels and cisterns.
What are some of the benefits of green infrastructure?
There are lots and lots of benefits to green infrastructure. Here’s a quick summary:
Environmental
The most obvious benefit is environmental. Green infrastructure:
- Cleans the water. Access to clean drinking water is essential to life. Green infrastructure restores and protects the quality of surface and ground water providing a source of clean drinking water for many people.
- Manages stormwater. By allowing water to soak into the ground or be temporarily held, green infrastructure reduces the amount of polluted stormwater flowing into the City’s combined sewer system.
- Cleans the air. Air quality is a major factor that contributes to asthma and other health issues. Trees and other plant life absorb pollutants like carbon dioxide, sulfur dioxide and nitrogen oxide and release oxygen, thereby naturally cleaning the air.
- Reduces energy use. Homes surrounded by trees are naturally cooler during the summer months. Talk a walk down a street on a hot summer day and you’ll immediately notice the difference when you are on a shady, tree lined street. Cumulatively, trees can help reduce air temperatures in the City, which are typically higher than nearby rural areas because buildings, roads and other structures retain heat. Green roofs also reduce the costs of operating buildings and extends the life of the roof components.
- Restores habitat. Trees and other native plants provide a natural habitat for birds and other animals, which in turn helps to maintain the existing biodiversity of plant and animal life.
Economic
Green infrastructure makes dollars and sense! And…
- Increases property values. Homes with trees or those that are located on tree-lined streets have higher resale values. A 2005 study by the University of Pennsylvania found that planting a tree within 50 feet of a house can increase its sale price by 10-15 percent.
- Benefits the local economy. People who shop in neighborhoods where there is more green space will pay 10 percent more compared to when shopping in areas without green space.
- Costs less than gray infrastructure. In contrast to gray infrastructure, green infrastructure costs significantly less to build and maintain because it is essentially mimicking natural habitat and doesn’t require energy to operate.
- Enhances a community’s livability. Improving parks and recreation areas and adding more green space to a community enhances quality of life for residents and attracts more visitors who contribute to the local economy.
Social
Living and working in and around significant green space has positive social effects including:
- Healthier people. Green urban communities have lower rates of obesity and long-term health-related diseases.
- Less crime. Research has also shown that green communities have less crime.
- Happier people. People who regularly interact with nature tend to be happier.
What is the estimated cost of the City’s green infrastructure plan?
Below is a summary of the GI Plan benefits and estimated costs. For more information, please see the City’s Green Infrastructure Plan.
| Parameter | 5-Year Implementation | 25-Year Implementation |
| Impervious Area Managed (ac) | 221 | 1,265 |
| Annual Runoff Reduction (MG/yr) | 182 | 1,053 |
| Annual Total Suspended Solids (TSS) Reduction (lb/yr) | 252,000 | 1,457,000 |
| Annual Total Phosphorus (TP) Reduction (lb/yr) | 4,800 | 27,800 |
| Annual Total Nitrogen (TN) Reduction (lb/yr) | 10,700 | 61,600 |
| Total Marginal Cost | $7,800,000 | $77,000,000 |
| Total Cost | $14,000,000 | $141,000,000* |
| Marginal Cost Per Gallon CSO Reduction ($/gal) | $.06 | $0.10 |
| Total Cost Per Gallon CSO Reduction ($/gal) | $.10 | $0.18 |
*This does not fully consider the ongoing costs associated with planning and design, maintenance, public education, administration of ordinances or implications of the Chesapeake Bay Watershed Implementation Plan and further EPA regulations.


